Thorough Analysis of a Bike Accessories Store
An Exploratory Data Analysis on a Bike Store
Tobou Egbekun
9/1/20253 min read


Tools: Power BI, SQL, Excel
Visuals for Project: Insight into a Bike Accessory Store
Source of Data: Kaggle
Project Goal
This is an analysis of a Bike Store, I analysed the sales trends, profit margins and demographics to find out the buying habits of their customers between 2011-2016.
Executive Summary
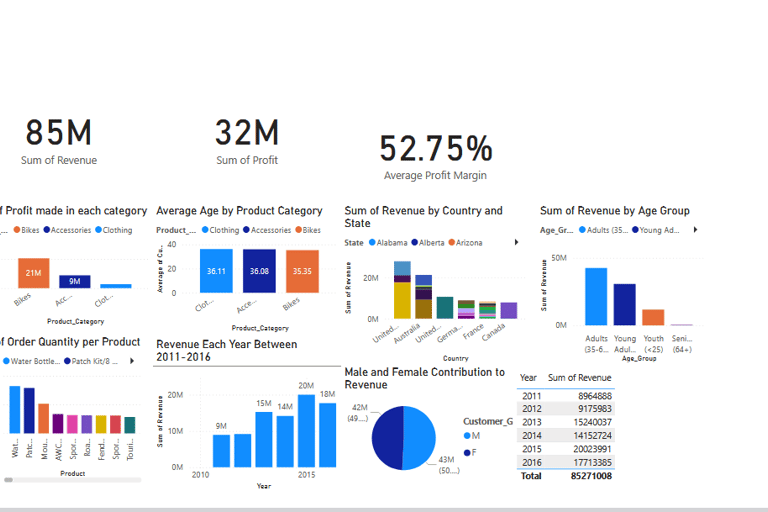
Total Revenue (2011-2016): $85M
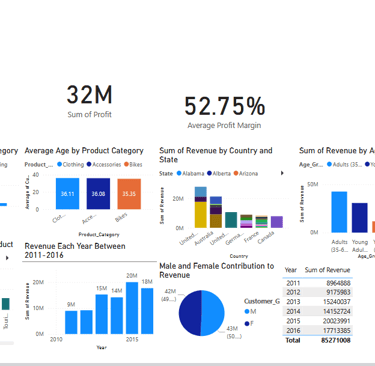
Average Profit Margin: 53%
Primary Customer: Professionals (35-50 yrs)
Key Opportunity: Use accessory bundles to drive high-margin bike sales and increase Average Order Value.
Strategic Recommendation: Replicate the successful California sales strategy in New York and Texas.
Methodology
I started cleaning the data by checking for null or duplicate values, then I started my exploratory data analysis.
Total Revenue per Year
SELECT Year,
SUM(Revenue) AS Total_Revenue
FROM sales_data
GROUP BY Year
ORDER BY Year;
Result: Identified 2015 as the year with the highest Revenue(20,023,991)
Most Profitable by Product Category
SELECT Product_Category,
SUM(Profit) AS Total_Profit
FROM sales_data
GROUP BY Product_Category
ORDER BY Total_Profit DESC;
Result: There are three main product categories(Bikes, Accessories and clothing). The Bikes category brought in the most revenue.
Top 5 Selling Products by Quantity Sold
SELECT Product,
SUM(Order_Quantity) AS Total_Sold
FROM sales_data
GROUP BY Product
ORDER BY Total_Sold DESC
LIMIT 5;
Result: Water Bottle 30z, Patch Kit/8 Patches, Mountain Tire Tube, AWC Logo Cap, Sport-100 Helmet, Red are the top 5 products in the store.
Average customer age by product category
SELECT
Product_Category,
AVG(Customer_Age) AS Avg_Customer_Age
FROM sales_data
GROUP BY Product_Category
ORDER BY Avg_Customer_Age DESC;
Result: Identified the average customer age for the Clothing-36 years, Accessories-36 years, Bike-35 years
Sales distribution by gender
SELECT
Customer_Gender,
SUM(Revenue) AS Total_Revenue,
COUNT(*) AS Transactions
FROM sales_data
GROUP BY Customer_Gender;
Result: Identified that Male Customers contribute to %50.82 of total Revenue while females contribute to 49.18%.
Which countries/states bring the highest revenue?
SELECT Country, State,
SUM(Revenue) AS Total_Revenue
FROM sales_data
GROUP BY Country, State
ORDER BY Total_Revenue DESC;
Result: Identified United States, California as the state and country bringing in the most revenue.
Monthly revenue trend
SELECT Year, Month,
SUM(Revenue) AS Monthly_Revenue
FROM sales_data
GROUP BY Year, Month
ORDER BY Year, Month;
Result: This showed monthly revenue between April 2011-May 2016
Profit margins per product (Unit Price vs. Cost)
SELECT Product,
AVG(Unit_Price - Unit_Cost) AS Avg_Profit_Margin
FROM sales_data
GROUP BY Product
ORDER BY Avg_Profit_Margin DESC;
Result: This showed the profit margin for each product
Which age group buys the most bikes?
SELECT
Age_Group,
SUM(Order_Quantity) AS Total_Bikes_Sold
FROM sales_data
GROUP BY Age_Group
ORDER BY Total_Bikes_Sold DESC;
Result: Identified Adults between 35-64 as the age group that brings in the most revenue.
Summary of Findings and Visuals Using Power BI
Total Sales:
The store made 85 million dollars in revenue between 2011-2016
Profit margin:
The business has an average profit margin of 52.75%.
Biggest Age Group Contributor to Revenue
The age group contributing the most revenue is between 35-64.
Profit made between 2011-2016
32 million dollars was the profit made between 2011-2016
Peak year
The year with the highest revenue was 2015(over 20 million dollars) before there was dip in sales performance in 2016(over 17 million dollars)
Key Insights and Data Driven Recommendations
Insight on target market focus
Our core customer is not just '35-64', but primarily affluent professionals aged 35-50 (subset of the data). They value quality and convenience over price.
Recommendation: Shift social media ad spend from broad platforms like TikTok to more professional and lifestyle-focused channels like Facebook/Instagram, targeting users in this age range with interests in cycling, outdoor activities, and wellness. Create content that speaks to training, adventure, and reliability rather than just price points.
Insight on Product Combination:
While accessories are top-selling by volume, Bikes have the highest profit margin. The goal of bundling should be to use high-volume accessories to drive sales of high-margin bikes.
Recommendation: Create 'Starter Kits': 'Road Warrior Kit' (Road Bike + Helmet + Water Bottle) or 'Mountain Explorer Kit' (Mountain Bike + Patch Kit + Tire Tube).
Price the bundle attractively to increase the Average Order Value (AOV) and clear accessory inventory.
I have identified that the age group between 35-64 is the demographic that contributes the most to revenue. I'd advise that the marketing message should be targeted towards individuals in this age group intentionally, especially if they want to amplify their marketing on social media.
Insight on Geographic Focus
California is our largest market, but it may be saturated.
Recommendation: Use California as a blueprint. Analyze why California is successful (e.g., specific marketing channels, popular products there) and replicate that strategy in other high-potential but underperforming states like New York or Texas. This is a more efficient use of ad spend than just doubling down on an already winning market.